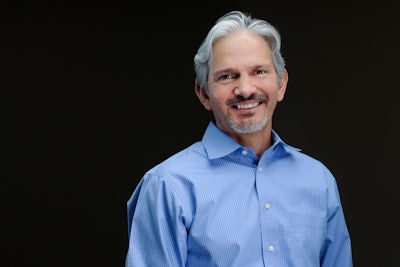
Technology now makes it relatively easy—and affordable—to collect data on attendees and analyze it in real time. This understanding of attendees’ interests and behaviors facilitates the development of responsive marketing strategies, helping planners meet their objectives and ultimately increase the R.O.I. of their conferences, trade shows, and other events. Art Borrego is C.E.O. of Alliance Tech, an event technology solutions provider focused on business intelligence. He spoke to BizBash about the current state of event analytics and how the data can be used effectively.
You are immersed in the world of event data and analytics. What do you see happening?
Technology is evolving very quickly, probably faster than we’ve seen in the past, with mobile, with wireless, with data visualization and analytics. The plethora of functionality and tools that are available as well as the fact that people—good or bad—are more open to sharing information about themselves, so more and more things are measurable each year.
From an event perspective there is so much that can be measured. Who planned to come—the demographics of those individuals through the registration tool—and then who actually is here. With real-time information it’s no longer looking in the rear-view mirror, it’s who is here now. Their movement—where are they now, where were they this morning—you can start to apply some predictive analytics to that to say what will they be doing later today or tomorrow. And then there’s the post-event perspective.
Tell us more about the measurement that can take place on site.
We can track their interests. What did they say when they filled out registration about their primary areas of interest, and then looking at behavior—what are they actually doing, where are they spending their time? What are people with similar interests doing, and what can I recommend to you if you are looking for suggestions? Looking at engagement, you can look at are people attending sessions, or did they register but they’re not really involved? There are some people who come in, check in, get their badge, and then we don’t see them again. That’s really low engagement. Then there are others who are really engaged, so being able to track that in real-time perspective is useful.
What types of tools can be used to gather this data?
For larger events it’s important to be unobtrusive. So R.F.I.D. is a U.H.F. frequency we typically use at larger events. It’s kind of like toll tags on toll highways, like a drive-by. We are able to capture behavior of many attendees without slowing down or creating queues. For other events, N.F.C. is the right approach. It is R.F. technology but it has very limited range of maybe five centimeters. It’s no longer unobtrusive. The attendee has to tap or someone has to scan. There are also QR codes that are being utilized for smaller events. And then there are Bluetooth low-energy beacons. The price has come down significantly. We have some pilots coming out in October with beacon wearables.
How do these beacon wearables work?
You’ve seen beacons in a retail environment like Apple Store. Those beacons are static, and people are moving around and interacting and receiving notifications from them on their mobile devices. But often people don’t want to turn on the Bluetooth on their phones because it will use up battery. So there’s also another model where there’s a small fob, about one inch in diameter, that is part of the badge and the attendee is wearing it. Instead of having the mobile app reading a static beacon, now the attendees are wearing the beacons and beaconing out. They can be read with standard devices like an iPad Mini, an iPhone, or an Android device. So instead of having to set up R.F.I.D. equipment like overhead readers or mats, for smaller events with smaller budgets they can purchase these beacons and that’s it. You can have traffic analysis because the beacons can be read up to 40 yards away, and the beacon ID is associated to the attendee so you can start to understand that person’s journey throughout the day. The price tag on the wearable fobs is about $5 right now and that price will continue to go down. And they can then be captured on the way out and reused for future events. So you are reducing cost per event for the beacons.
So now planners can get an honest look at an attendee’s behavior at an event versus just getting feedback on a survey?
Exactly. You might tell me something on a survey, but then your actions and your behavior might be different. You might have enrolled for certain sessions using the mobile app or agenda builder but then once you are on site your behavior may change. We can look at what sessions did you attend, what topics or products did they pertain to, what demos did you visit, what lead scans were you captured on. All of that information shows a lot about the attendee journey. Many times it does deviate from what you planned, and it’s important to capture that journey and those touch points because it’s more meaningful.
And how is this data being used?
Integrating with marketing automation tools is becoming more common and critical. Companies are now tracking a 360-degree view of their prospects as far as did you visit a website, did you download a whitepaper, did you attend a webinar, did you go to an event? And then capturing the on-site touch points—every session you attend is an important touch point. I have to register, potentially pay money, fly, be on site, and I am physically in that room watching that session, that’s a lot more telling and committed touch point than, say, a webinar. So then we can push all those touch points into a marketing automation tool so sophisticated marketers can put together a campaign to say if an attendee came with this profile and did this and this, then let’s offer them this promotion or follow-up.
You mentioned the attendee-tracking data goes into the cloud so it can be analyzed in real time. How can that affect what takes place during an event?
Sales people want to know what their accounts are doing at an event. So maybe they get a nudge as they walk in the expo that tells them which of their customers are there now and what areas they have been scanned by, so they can get a sense of their interests and can engage with them. You can see it at the aggregate company level and then also drill down per attendee—for example, what’s the vice president of technology doing at this event? If he’s interested in these products or categories, I can talk to him about these other new products that might apply to him. So with that real-time data they can engage in a more meaningful way on site. Information is valuable post-event, but if that info can be used on site that might be saving some trips and accelerating the sales process.
In addition to attendee tracking, can you tell us about any other technology developments that can help planners evaluate R.O.I.?
Text analytics are also now available. You can take the electronic surveys that are coming in … and the text analytics are now strong enough and smart enough to be able to read the comments and be able to categorize them and to say if it’s a positive comment or a negative comment. So you can get a sense for a given customer how do they feel about the overall conference or specific session content or the speaker.

